Description
This track shows the multiple genome alignment of 36 Drosophila species. It also shows the measurements of evolutionary conservation using phastCons and phyloP from the Phylogenetic Analysis with Space/Time models (PHAST) package.
Methods
Whole Genome Alignments
The genome assemblies for 35 Drosophila species were obtained from the NCBI RefSeq database. Each Drosophila genome assembly was aligned against the Drosophila melanogaster (dm6) assembly using LAST. The following table shows the 36 Drosophila genome assemblies used to construct the ROAST Alignments track:
The initial set of whole genome alignments were filtered using the 2-split, post-masked strategy with last-split and last-postmask to construct the one-to-one alignments between D. melanogaster and the target genome. The alignments were then processed using the utilities developed by the UCSC Genome Bioinformatics Group. These whole genome alignments were combined into a multiple sequence alignment using ROAST.
The codon translations associated with the multiple sequence alignment were based on FlyBase release 6.46 for D. melanogaster.
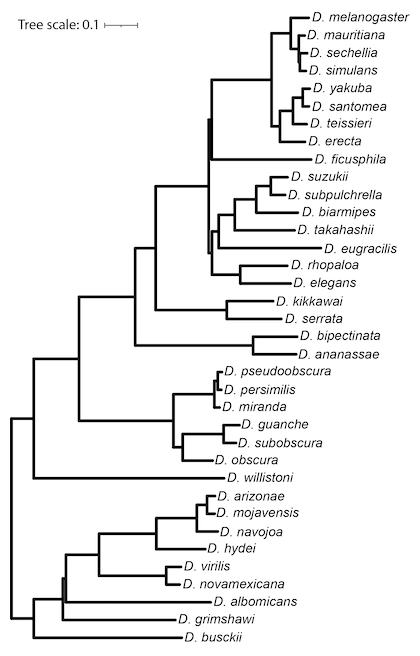
Phylogenetic Tree Model
The non-conserved model used by phastCons and phyloP was constructed by the phyloFit program from the PHAST package based on four-fold degenerate (4d) sites. The 4d sites were defined by the FlyBase gene annotations, and extracted from the multiple sequence alignment using msa_view. The non-conserved phylogenetic model was estimated by phyloFit using the general reversible (REV) substitution model, the EM algorithm, and medium (MED) precision.
PhastCons Conservation
Conserved elements were identified by phastCons using a target coverage of 0.3 and an expected length of 45. The conserved model is defined as a scaled version of the non-conserved model with the scaling factor rho of 0.3.
PhyloP Conservation
The conservation score for each site of the alignment was determined by phyloP using the likelihood ratio test (LRT) and the CONACC mode. Sites with positive scores indicate conservation while sites with negative scores indicate acceleration.
Display Conventions and Configuration
In full and pack display modes, conservation scores are displayed as a
wiggle track (histogram) in which the height reflects the value of the
score. The conservation wiggles can be configured in a variety of ways to
highlight different aspects of the displayed information. (See the "Configuring
graph-based tracks" page for details.)
Pairwise alignments of each species to the D. melanogaster genome are
displayed below the conservation histogram as a grayscale density plot (in
pack mode) or as a wiggle (in full mode) that indicates alignment quality.
In dense display mode, conservation is shown in grayscale using
darker values to indicate higher levels of overall conservation
as scored by phastCons.
Checkboxes on the track configuration page allow selection of the
species to include in the pairwise display. The "+" and "-" buttons allow
you to select or unselect multiple species at once. Note that excluding species
from the pairwise display does not alter the conservation score display.
To view detailed information about the alignments at a specific
position, zoom the display in to 30,000 or fewer bases, then click on
the alignment.
Gap Annotation
The following display conventions are used to depict the different types of gaps
in the alignment:
- Single line: No bases in the aligned species. Possibly due to a
lineage-specific insertion between the aligned blocks in the D. melanogaster genome
or a lineage-specific deletion between the aligned blocks in the aligning
species.
- Double line: Aligning species has one or more unalignable bases in
the gap region. Possibly due to excessive evolutionary distance between
species or independent indels in the region between the aligned blocks in both
species.
- Pale yellow coloring: Aligning species has Ns in the gap region.
Reflects uncertainty in the relationship between the DNA of both species, due
to lack of sequence in relevant portions of the aligning species.
Genomic Breaks
Discontinuities in the genomic context (chromosome, scaffold or region) of the
aligned DNA in the aligning species are shown as follows:
- Vertical blue bar: Represents a discontinuity that persists indefinitely
on either side, e.g., a large region of DNA on either side of the bar
comes from a different chromosome in the aligned species due to a large-scale
rearrangement.
- Green square brackets: Enclose shorter alignments consisting of DNA from
one genomic context in the aligned species nested inside a larger chain of
alignments from a different genomic context. The alignment within the
brackets may represent a short misalignment, a lineage-specific insertion of a
transposon in the D. melanogaster genome that aligns to a paralogous copy somewhere
else in the aligned species, or other similar occurrence.
Base Level
When zoomed-in to the base-level display, the track shows the base
composition of each alignment. The numbers and symbols on the Gaps
line indicate the lengths of gaps in the D. melanogaster sequence at those
alignment positions relative to the longest non-D. melanogaster sequence.
If there is sufficient space in the display, the size of the gap is
shown. If the space is insufficient and the gap size is a multiple
of 3, a "*" is displayed; other gap sizes are indicated
by "+".
Codon translation is available in base-level display mode if the
displayed region is identified as a coding segment. To display this annotation,
select the species for translation from the pull-down menu in the Codon
Translation configuration section at the top of the page. Then, select one of
the following modes:
- No codon translation: The gene annotation is not used; the bases are
displayed without translation.
- Use default species reading frames for translation: The annotations from
the genome displayed in the "Default species to establish reading frame"
pull-down menu are used to translate all the aligned species present in the
alignment.
- Use reading frames for species if available, otherwise no translation:
Codon translation is performed only for those species where the region is
annotated as protein coding.
- Use reading frames for species if available, otherwise use default species:
Codon translation is done on those species that are annotated as being protein
coding over the aligned region using species-specific annotation; the remaining
species are translated using the default species annotation.
References
Frith MC, Kawaguchi R. Split-alignment of genomes finds orthologies more accurately. Genome Biol. 2015 May 21;16(1):106. doi: 10.1186/s13059-015-0670-9.
Hubisz MJ, Pollard KS, Siepel A. PHAST and RPHAST: phylogenetic analysis with space/time models. Brief Bioinform. 2011 Jan;12(1):41-51. doi: 10.1093/bib/bbq072.
Kent WJ, Baertsch R, Hinrichs A, Miller W, Haussler D. Evolution's cauldron: duplication, deletion, and rearrangement in the mouse and human genomes. Proc Natl Acad Sci U S A. 2003 Sep 30;100(20):11484-9. doi: 10.1073/pnas.1932072100.
|